


Some Finer-Scale Mapping of the Ongoing Petroleum Depletion Process
Courtesy of the underlying labor of several young academic biophysical economists
The basic framework for examining and understanding the fossil fuels depletion problem pioneered by people like Hubbert, Odum, Hall, and Mearns, has lately been elaborated and made more quantitative and useful by a number of younger academics.
Fizaine and Court (2016), for example, have used the detailed economic data available for the US to more rigorously statistically estimate the minimum societal energy return on energy invested (EROI) necessary to maintain and grow the kind of industrialized societies and institutions that arose during the post-World War II global economic expansion. In the case of the US, these authors have determined that it is impossible for the country to maintain its post-World War II industrial way of life if it spends more than 11% of its annual gross domestic product on energy costs. This cost corresponds to a societal EROI of 11:1 – a value slightly different than the older, qualitatively-determined values of 10:1 and 15:1.
Note here that a societal EROI differs from the EROIs for a particular fuel like petroleum or fire wood in that the societal EROI indicates the ratio of all societal consumption and growth (numerator) divided by all the energy consumed in producing the materials and services for that consumption and growth.In the case of a fuel EROI, on the other hand, its EROI more locally represents only the energy initially consumed in producing the surplus fuel of a certain type and use for a society.As will be shown later, the societal EROI can be approximated very easily by using the national accounts GDP data freely available for many countries, and by employing the EROI formula, societal EROI = (100-%GDP energy expenditures)/%GDP energy expenditures.1

In 2017 the same authors graphically published their laboriously established estimates of the global well-head and mine mouth EROIs for petroleum, natural gas, and coal for the 1800-2012 time period.

Digitization of the global petroleum EROI data from this graph and use of a logarithmic scale make it clear in Figure 3 that Morgan’s (2024) data are correct, and the global EROI value for oil is now about only 10:1. According to Table 3 of Fizaine and Court above, this oil EROI is now too far below the minimum necessary 19:1 EROI value to provide sufficient support – on its own – to the continued maintenance and growth of modern societies.

Next, Dupont et al. (2021) estimated the global societal EROI for the year 2018. Their published societal data point is employed below as a check of an application of the simpler GDP-based societal EROI estimation technique mentioned earlier.
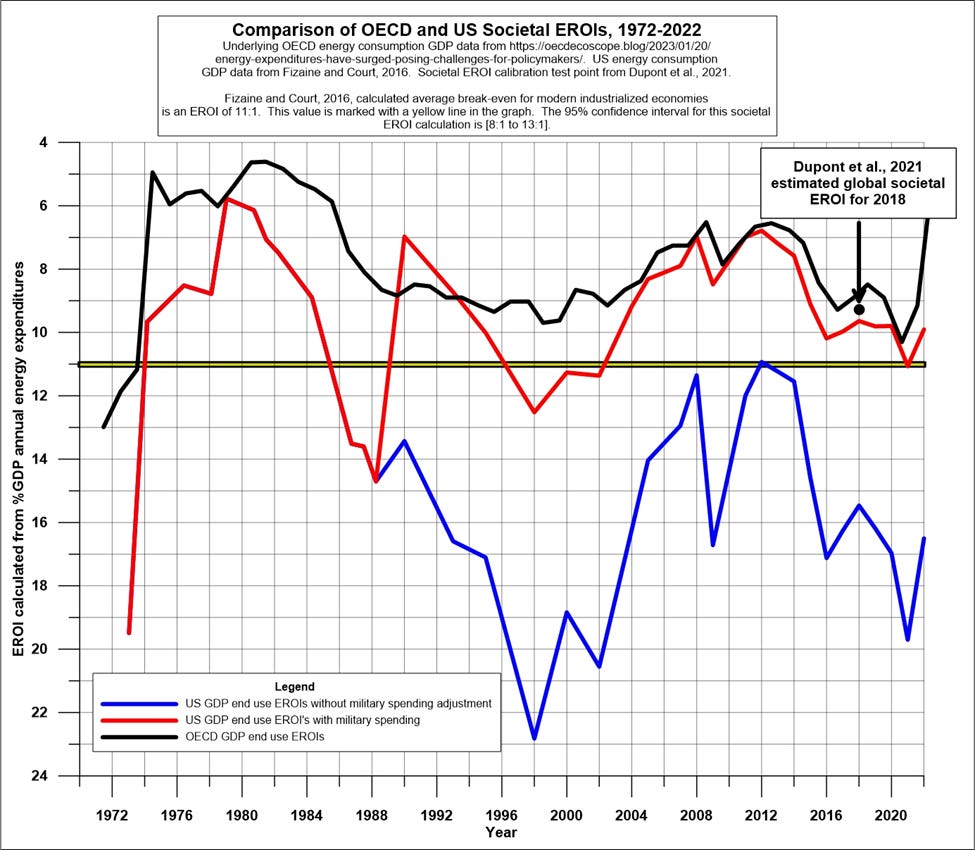
According to the Figure 4 data array, the OECD nations have – in the aggregate -- been left high and dry with regard to energy since about 1973, while the US enjoyed two brief respites from the effects of fossil fuels depletion: ~1985-1989 (“Reagan era boom”), and 1996-2002 (“United States boom”). Both of these minor US economic respites are marked above by dips of the US societal EROIs below the minimum 11:1 societal EROI threshold. Without the US military spending then being directly applied to the benefit of the energy industry, it appears that the period between 1989 and the present would (blue line) have been a period of continued economic maintenance and growth. On the other hand, without that military spending, things might have been even worse for both the US and the other developed countries.
Post-1988 US GDP percentages spent on military spending were obtained from https://www.macrotrends.net/global-metrics/countries/USA/united-states/military-spending-defense-budget. They are extremely significant (3-5% of annual US GDP) in view of the total now-normal 6-8% GDP scale of US %GDP energy expenditures per se.
Fizaine and Court (2016) provide the following reconstruction of the US energy source mix through time. Biomass includes fire wood, animal fodder, and human food. Among other things, this diagram illustrates the reasons for the generally waning degree of social and economic influence of skilled and unskilled workers, and the small-scale farmer and rancher as the US got older.

Converting the above US historical %GDP energy expenditure data into societal EROIs yields a long run historical perspective of the US with regard to energy use and surplus energy availability.

Societal EROI in the US began increasing from its early subsistence biomass-dependent level of 5-7 up to about 12 as coal use spread throughout the economy from the 1850s through the start of the 20th century.2 The then historically high level of societal EROI of 11-13 from 1890 to 1910 was matched by economic growth rates of greater than 7%/year. Immediately thereafter, however, the US economy evidently overshot the mark by too rapidly investing in initially inefficient industrial electrification, and thereby displacing much labor and creating economically-crippling chronic unemployment – a high level of unemployment that did not slacken except briefly during World War I, and then during and after World War II.
Following that long period of economic stagnation (and its included Great Depression), the US economy was buoyed upward by a deep, energy-rich pool of oil and gas capable of generating high societal EROI values much greater than the minimum 11:1 required for economic systems maintenance and growth.
This pool was sufficiently depleted, however, by the mid-1970s to drop the US societal EROI below this minimum required societal EROI for significant periods of time, consequently damaging the upkeep and growth of systems established during the post-World War II economic expansion.
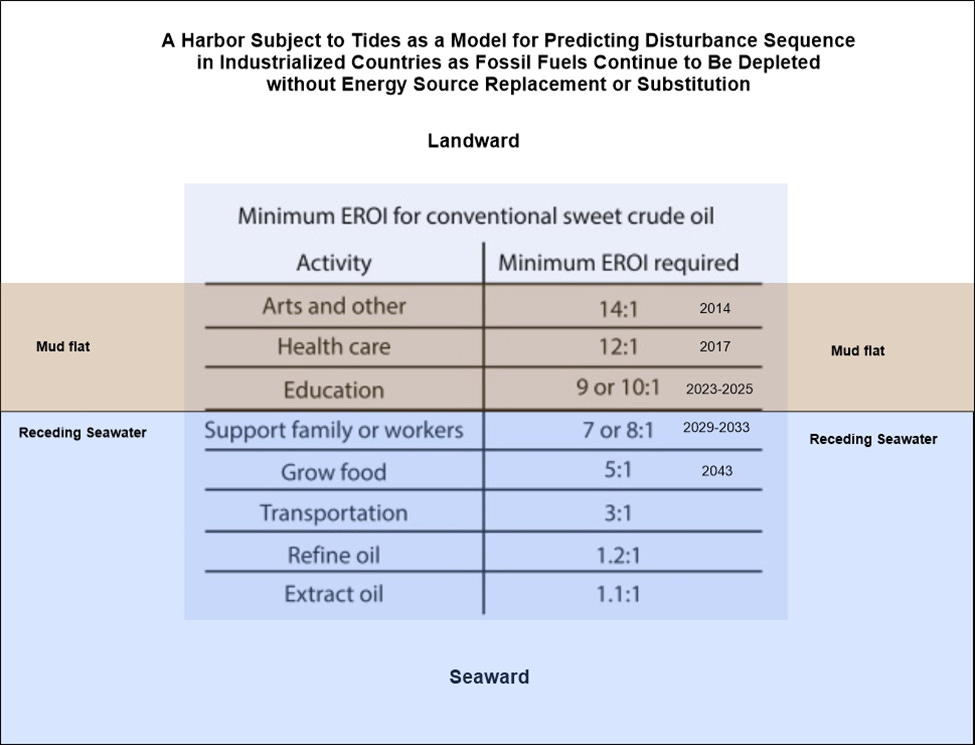
Recall this earlier presented Figure 7 “harbor model” of the societal effects of fossil fuels depletion on Western style industrialized polities. It qualitatively highlights the proposition that as fossil fuels depletion occurs, formerly functional systems in industrialized countries sequentially suffer degradation and decreasing effectiveness. The detailed record for the US shown in Figure 6 of this post shows that it is more complicated than Figure 7 above suggests. Each of the systems listed below have taken repeated damaging hits since the oil crises of the 1970s, damage that sequentially occurs over and over again as societal EROI levels repeatedly drop below the minimum required 11:1 societal EROI for the US. See Figure 6 and note the major societal EROI drops that occurred within the current energy era marked there with light red shading. The periods of societal EROI perigee there correspond very closely, if not exactly, with the timing of academic achievement score failures and decreases in US and other country life expectancy documented in my last post.
All of the younger economists cited here for some reason have chosen to independently duplicate the results of national accounting by their own independent labors, working to the same end from the ground up all over again. Perhaps they mistrust government accounting, but I suspect it only follows the modern tendency in academic economics of working to prove scientific credibility through published display of involved mathematical operations. This reminds me of over nice home ale brewers who meticulously clean out their fermentation vat with detergents and bleaches when the preliminary boiling and the hops used in the ordinary fermentation process act as sufficient preventatives against feared wort and ale souring.
Notice in Figure 6 that the US did not start to become appreciably urbanized until coal significantly entered the economy, and that this urbanization process further accelerated upon the later entry of oil and gas into American life. This long urbanization trend started flattening out after the two 1970s oil crises, however.
I appreciate your reply. Thank you. But to me (& most of my peer group), collapse is well underway. I live in Australia... one of the highest living standards in the world. BUT... I was born in 1947 in one of Australias capital cities (Brisbane). Today here are a list of problems not present in the 50's & 60's as I grew into my twenties & bought my first house that cost me 20% more than my annual salary. All of these problems are directly related to massive decline in available energy per capita & therefore the cost per unit of energy (petrol/gasoline for example.
Problems today not present in 1960's. Or present at extremely small unnoticed rates
1). Homelessness... & growing
2). Drug epidemic & drug addiction
3). Youth suicide (Australia about 7th globally.... so much for our high living standards).
4). Unaffordable housing. (My first house in 1979 cost me 20% more than my annual salary. Today average house price close to AUD$1.5m. Average full time salary about AUD$80,000. So just under 20 years of 100% of your (Before Tax) salary to buy an average home in a capital city..... This is COLLAPSE.).
5). Fuel costs. In 1970 in Australia petrol/gasoline cost 4 cents per litre (not a misprint). It cost me AUD$2.00 to fill my V8 Ford in 1970. Today my V8 Land Cruiser (120 Litre tank). Costs about $250 to fill. This is Energy Collapse due to decreasing EROEI.
6). In 1960's & 1970, it cost about $1 million AUD to build 2 km of 2 lane road... today, due to energy & employment costs it is AUD $500 million per km for freeways in cities.
7) Because of the above figure, infrastructure in Australia is horrendous. Our cities are traffic clogged, our secondary country roads are unimproved, our tertiary roads are pot holed disasters.
8). City life has declined alarmingly, small apartments, clogged streets, extensive 90+ minute commutes for outliers in cheaper fringe suburbs packed & inadequate public transport, no intracity metro systems. Add this to the drug & homeless problems noted above....City life declines alarmingly.
9). So escape to lovely country towns... we have lots of these. And yes, there is a major demographic shift to these lovely towns. But you should have done that 25 years ago. Now, real estate prices in these life style towns are the same as the cities... in other words, basically unaffordable to the average person.
10). Australia has huge coal, natural gas & uranium reserves.... BUT we have NO fuel/oil. We import 97% of our petrol/diesel needs. We are totally dependent on middle east Sheikhdoms & other dodgy countries for our agriculture, construction & transport industries, let alone private transport. We are 3 weeks (storage is 20 to 25 days) away from disaster. Let this sink in for a moment. Australia is less than 1 month away from no food in supermarkets, no agriculture transport, no food processing or distribution. If this is not impending collapse... please reassure me that solar panels & Tesla trucks will save us. OMG?
11). Because of our coal fired electricity system & our coal exports and our car culture and our cities horrendous public transport options... Australia is the highest per capita polluters of Carbon. BOOM. There goes our fresh, clean, green image
12). A final quick note... New Zealand's energy situation (No oil. No coal. No natural gas). Is even worse than Australias.
All of the above problems are a direct result of declining energy.
So... to me, civilisation decline is obvious. And worsening. Let's revisit this discussion and observations in 2030, and 2050.
Aa for Global Warming.. thank you for the reference. Yes, crops will still be grown in high temperatures of the future. But, increasing droughts, farm land deterioration, lower crop yields will lead to increasing food insecurity. I was in India last month.. my third visit since 1977. A classic case of overshoot, food insecurity and poverty. Go check out the families living in the dirt under freeways... offer their begging children a $5 bill.... and watch what happens. This is all a result of the collapse of our oil dependent civilisation. Add in sea level rise of over 1 metre by 2100... Mass migration inlands to places already overcrowded, city inundation (already happening in Miami & coastal areas everywhere... see Bangladesh disaster), food insecurity and energy decline as described in the article we are discussing. It's all over for millions of people. And that's collapse.
Thank you for your reply. I really appreciate it. As I stated in my first comment, EROEI (and Energy Density).... both declining significantly, are never discussed but are the critical parameters for industrial civilisation. Your article was brilliant.
This is undoubtedly the most important metric in the coming collapse of industrial/technological civilization. Declining EROEI below maintenance needs PLUS Global Warming/Sea Level rise will doom modern civilization well before the end of this century.